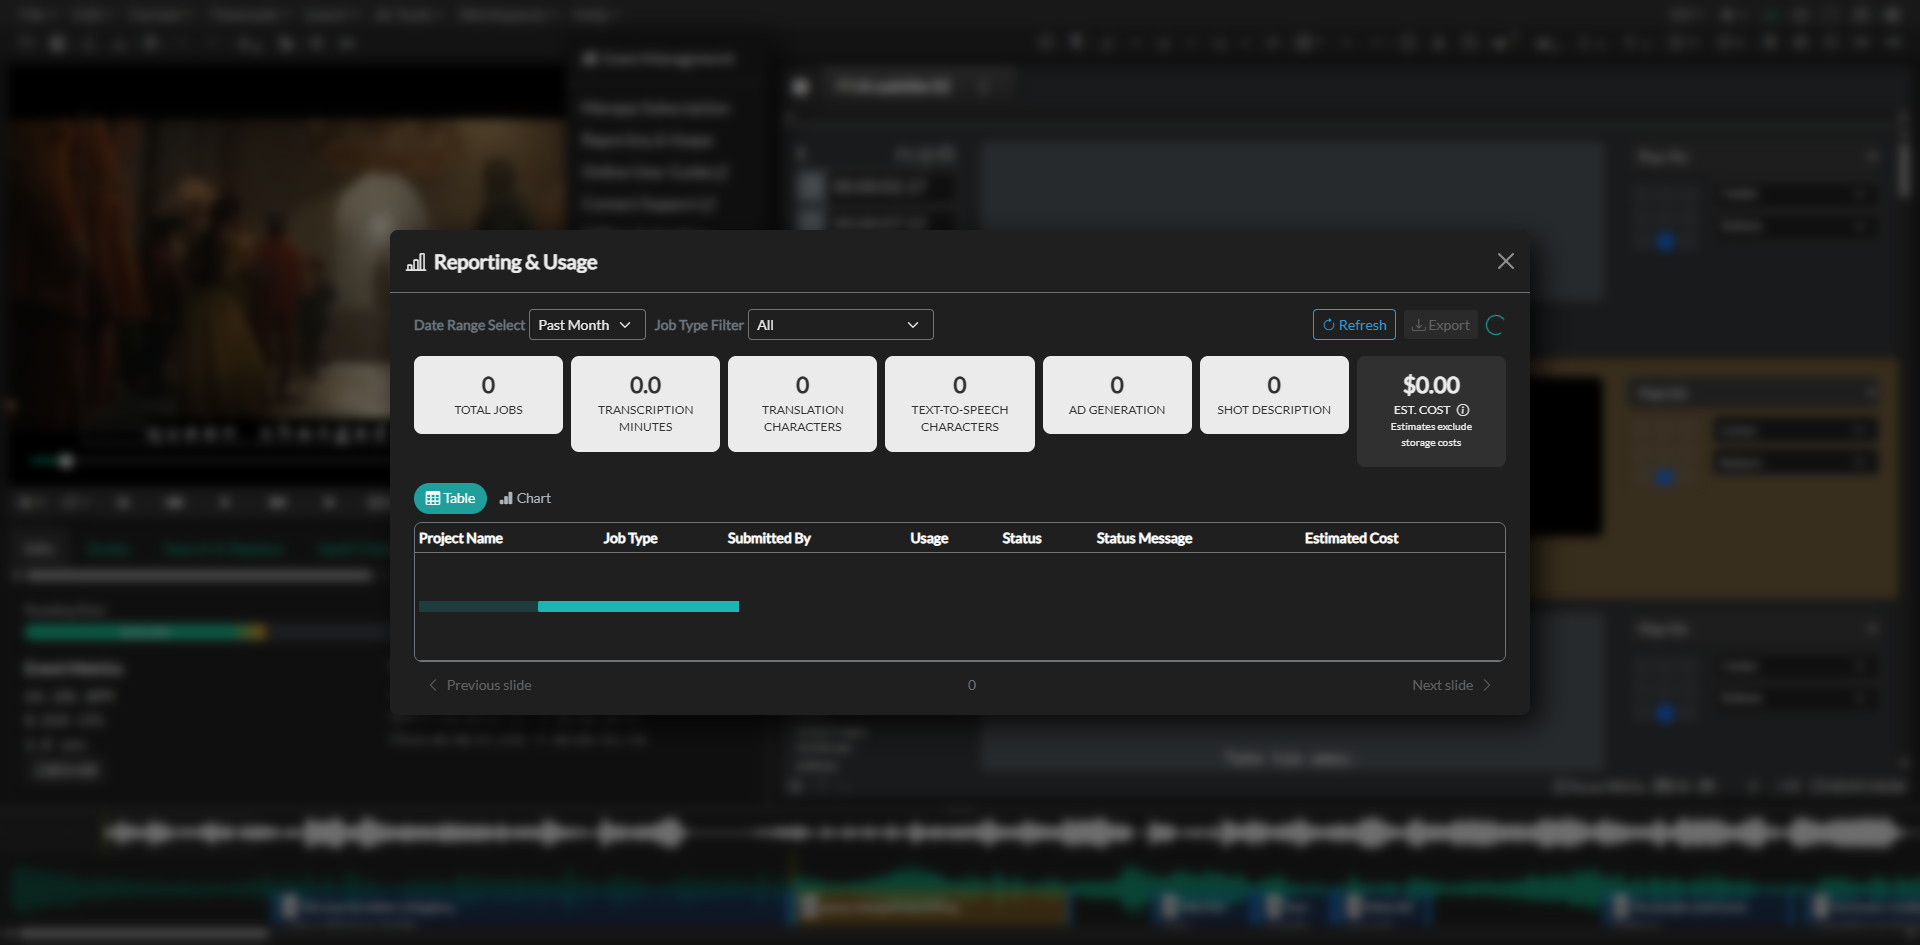
Reporting & Usage
The Reporting & Usage dashboard gives team administrators a consolidated view of all AI job activity — transcription, translation, text-to-speech, and embed jobs — over a selected time period. Each completed job is listed with its usage metrics and an estimated cost based on published per-unit rates, making it straightforward to track consumption across the team and produce usage reports for billing or audit purposes.
Prerequisites
- A Pro or Enterprise team account.
- You are signed in with an Admin or Manager role.
- At least one AI job has been completed and passed within the selected date range.
Navigation paths
- Team menu → Reporting & Usage.
Date range and filtering
The filter bar at the top of the dashboard controls which jobs are included in both the summary cards and the job list.
Date Range offers four preset options — Last 24 Hours, Past Week, Past Month, and Past Year — as well as a Custom option. When Custom is selected, a start date and end date input appear. Both fields must be filled in before the Refresh button becomes active.
Job Type narrows the results to a specific job category. The available options are All, Transcription, Translation, Text to Speech, and Embed. Changing either filter does not automatically reload the data; click Refresh to apply the new filter and fetch updated results.
Summary cards
Five summary cards are displayed across the top of the dashboard. They reflect the totals for the current filter period only and update each time a refresh is performed.
Total Jobs shows the number of jobs with a Passed status within the selected period and filter.
Transcription Minutes is the cumulative duration of all transcription jobs, expressed in minutes.
Translation Characters is the total character count across all translation jobs.
TTS Characters is the total character count across all text-to-speech jobs.
Estimated Cost is the sum of all per-job cost estimates for the period, calculated at the following rates:
| Job type | Rate |
|---|---|
| Transcription | $0.10 per minute |
| Translation | $0.00005 per character |
| Text to Speech | $0.00005 per character |
| Embed | $2.00 per job |
The estimated cost is an approximation. Actual charges depend on your subscription plan and any applicable discounts or credits negotiated with your account.
Table view
The table view is the default display mode when the dashboard opens. It lists every individual job that matches the current filter criteria. Only jobs with a Passed status are shown — jobs that are still processing or that failed are not included.
Each row in the table contains the following columns:
- Project Name — the name of the project the job was run against.
- Job Type — the category of AI job (transcription, translation, text to speech, or embed).
- Submitted By — the email address or display name of the team member who submitted the job.
- Usage — for transcription jobs, the duration in minutes; for translation and text-to-speech jobs, the character count; for embed jobs, a count of processed files.
- Status — a badge indicating whether the job passed.
- Status Message — the first 30 characters of the job's status message, displayed as a truncated preview. Hover over the cell to see the full message.
- Estimated Cost — the calculated cost for that individual job.
The table scrolls independently and can hold the full job list for the period without paginating. Use the Export button to download the full dataset if you need to work with it outside the application.
Chart view
Switching to the Chart view replaces the table with a bar chart that aggregates job activity over time. Click the Chart tab above the table to switch views.
Each bar in the chart represents one time bucket. For the Last 24 Hours, Past Week, and Past Month date ranges, the chart uses daily buckets. For the Past Year range, it uses monthly buckets. Buckets with no activity show a zero-height bar.
The Metric selector in the top-right of the chart view controls what each bar represents:
- Cost — the total estimated cost for jobs in that bucket, in USD.
- Job Count — the number of passed jobs in that bucket.
- Minutes — total transcription minutes in that bucket (excludes other job types).
- Characters — total characters across translation and text-to-speech jobs in that bucket (excludes other job types).
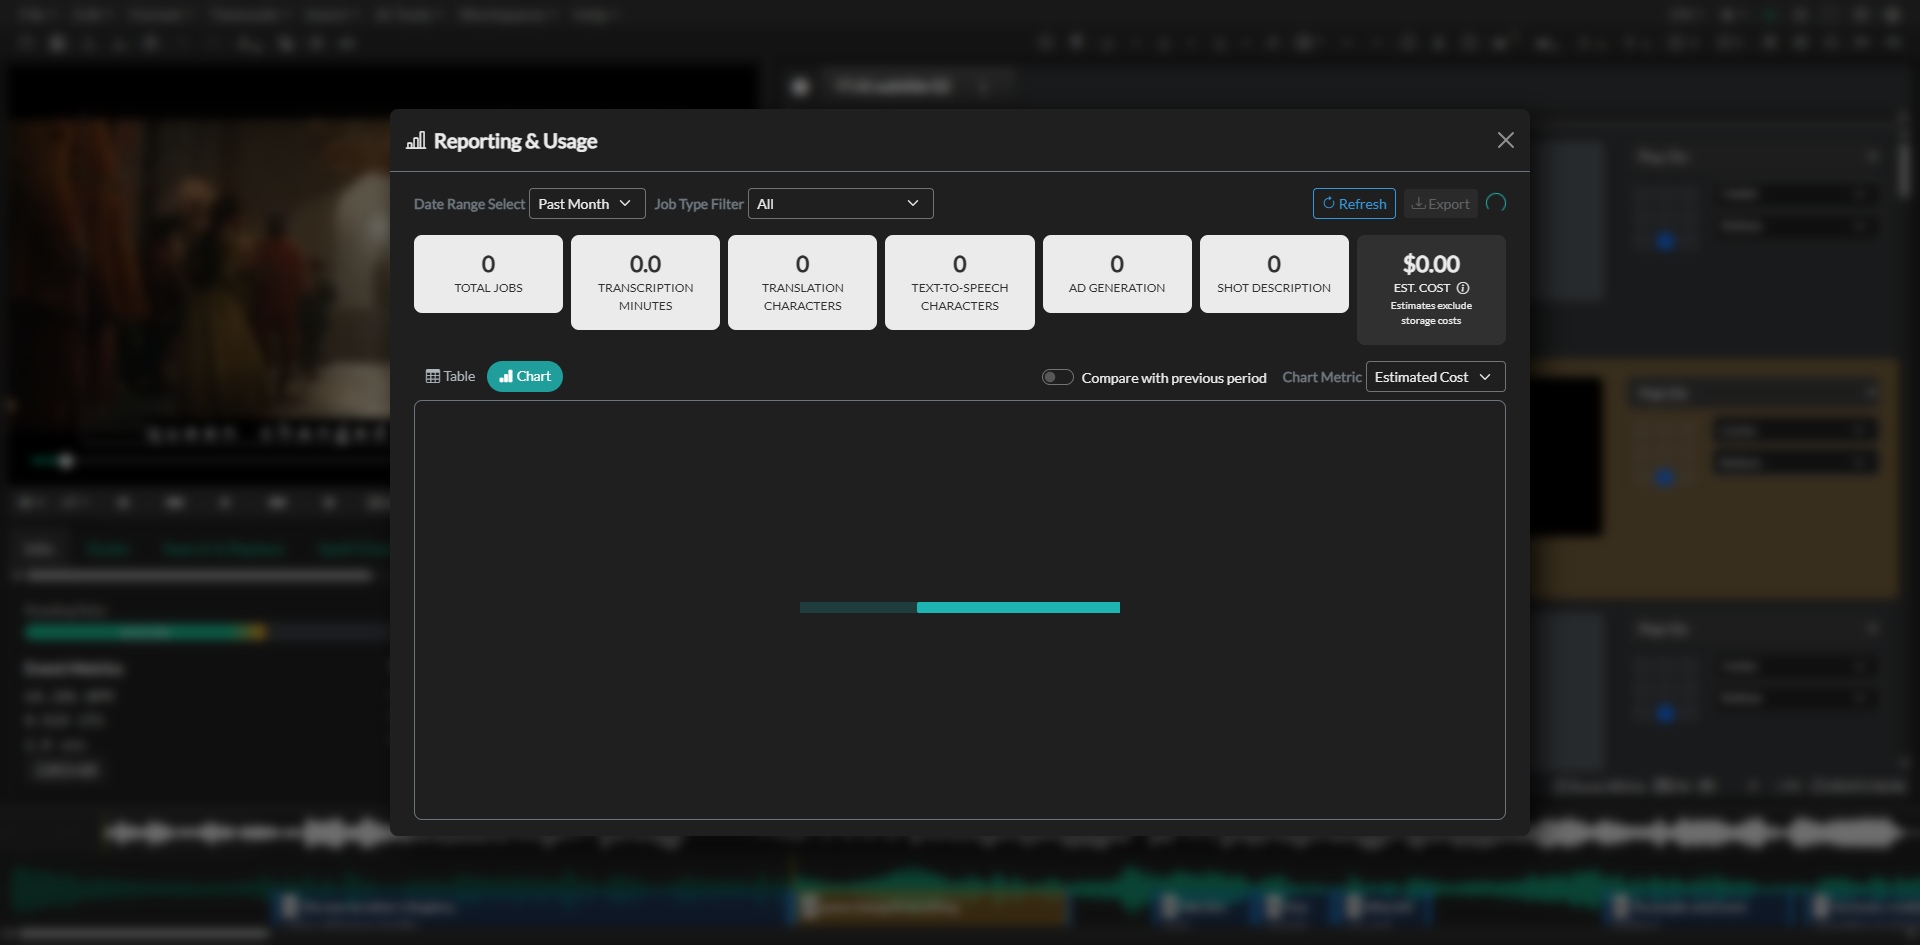
Period comparison
When the Chart view is active, the Compare to Previous Period toggle overlays a second data series onto the chart representing the period immediately before the current one. The previous period spans the same duration as the current period, ending at the start of the current period. Both series are aligned by ordinal bucket position so you can directly compare equivalent time slots side by side.
The comparison data series is shown in a lighter shade of the same color as the current period, and a legend is displayed above the chart identifying each series. Summary cards and the table are not affected by the comparison toggle — they always reflect the current period only.
Exporting results
The Export button in the filter bar downloads a CSV file of the current job list. The button is disabled until results have been loaded. The file is named ccc_usage_YYYY-MM-DD.csv using the date of export.
The CSV includes all columns shown in the table view, plus three additional timestamp columns — Created On, Updated On, and Completed On — which contain the full date and time for each job. The file is UTF-8 encoded with a byte-order mark for compatibility with Microsoft Excel.